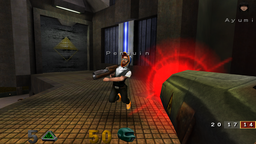
Played sessions
Testing is done with Walnut's rating tool (walnut-rate, on the console): how ratings are made and submitted.
Same in every session:
Walnut 0.1,
openarena 0.8.8+dfsg-13
The platform builds under it (3)
| Linux kernel | 6.12.111+ps3.747 Walnut's build |
|---|---|
| Mesa | 26.2.4-1+ps3.721 Walnut's build |
| ps3rsx | 0.735+k6.12.111+ps3.747 Walnut's build |
| Date | Launcher | Rules | Play | Ended | Picture | |
|---|---|---|---|---|---|---|
| 2026-10-25 | OpenArena (GL 2.0) | 1.0 | 9 min | quit | ok | Details |
| 2026-10-25 | OpenArena (GL 1.2) | 1.0 | 12 min | quit | ok | Details |
Download all sessions as CSV (one row per session, the aspects as columns)
Rating history
The rating on each version it was tested on, newest first: each row is rated from that version's sessions alone, under the newest rules those sessions have the data for.
OpenArena (GL 2.0)
| Version | Tested | Medal | Rules | Frame rate | Smoothness | Sound | Picture | Stability | Display | Load | Play |
|---|---|---|---|---|---|---|---|---|---|---|---|
| Walnut 0.1 openarena 0.8.8+dfsg-13 |
2026-10-25 | Gold · 82 | 1.0 | 64 | 67 | 100 | 100 | 91 | - | 98 | 0.2 h 1 test |
OpenArena (GL 1.2)
| Version | Tested | Medal | Rules | Frame rate | Smoothness | Sound | Picture | Stability | Display | Load | Play |
|---|---|---|---|---|---|---|---|---|---|---|---|
| Walnut 0.1 openarena 0.8.8+dfsg-13 |
2026-10-25 | Silver · 76 | 1.0 | 42 | 68 | 100 | 100 | 91 | - | 100 | 0.2 h 1 test |
Scripted benchmarks
Not rated: tests of driver and game changes. A script plays the same scene on the PS3 again and again (the desktop stopped, vsync off) to compare two builds of the game or of the graphics driver. The numbers say which build is faster; they never feed the medal.
How the script plays it: OpenArena: timedemo of bench.dm_71, renderer and texture compression per variant.
The recipe's full description
OpenArena (ioquake3 0.8.8): timedemo of bench.dm_71 (as legacy/step0.sh), renderer and texture compression per variant. The game archives +set cvars to q3config.cfg on quit. Steady state: the timedemo repeated in one session (PASSES=1: every pass prints its line; passes starting 54 s or more after the first map load are counted until ~120 s, then the game is stopped). nextdemo is cleared before it runs (CL_NextDemo), so each pass sets it again: bench_loop = "set nextdemo vstr bench_again; demo bench", bench_again = "meminfo; vstr bench_loop" (in autoexec.cfg). Every pass reloads the map (CL_InitCGame again; opengl2 without r_glslKeepPrograms compiles its programs again too). fps=, maxms= and load= are the first pass's, as the single timedemo had them; steady is the median of the measured passes.
53 variants of the recipe
base stands for the game | the recipe as it is, without a variant |
|---|---|
tc0 | opengl1, uncompressed textures (step 0's tc0) |
tc1 | opengl1, compressed (shipped default, step 0's tc1) |
gl2min stands for the game | - |
gl2 | - |
gl2min_up | every switch of ours back to upstream (Debian's behaviour, except the VAO cache and the model tangents, which have no switch: for those, compare with Debian's deb) |
gl2min_shaders | 0001: shader objects kept attached after linking (their source and IR in Mesa) |
gl2min_bones | 0002: the 27 bone-animation programs (105-matrix arrays, compare trees on nv30) |
gl2min_fboprog | 0003: the 15 shadow and post-processing programs that need framebuffer objects |
gl2min_recompile | 0004: every program compiled again at the demo's map load (load time, the second compile burst) |
gl2min_lazy | 0005 (opt-in): each program built at its first use; stalls when a variant is first drawn |
gl2min_modelverts | 0007: the permanent CPU copy of every MD3 vertex frame (hunk: ~87 MB for the demo's models) |
gl2min_lods1 | 0009 (opt-in): only the full-detail LOD of each model (no _1, _2: -41% model memory, more vertices) |
gl2min_lodbias1 | 0009: r_lodbias 1, LOD 0 never drawn so no longer loaded (-59% model memory, coarser models) |
gl2min_cpuanim | 0010 (opt-in): MD3 animation on the CPU as opengl1 (no model VBOs, 18 fewer programs, more PPE) |
gl2min_lean | settings only: lazy and lods1 together; texture resolution (r_picmip 2 against ioquake3's default 1; the run's q3config.cfg holds what OpenArena had); uncompressed textures in gl2 |
gl2min_picmip2 | - |
gl2min_tc0 | - |
gl2min_color16 | 0027: vertex colours as unsigned shorts again (R16G16B16A16_UNORM, which nv30 can't fetch: u_vbuf converts them on the CPU at every draw, and nouveau keeps malloc'ed copies of the VRAM buffers it reads, after a few such reads of every new one: docs/MEMORY.md "OpenArena opengl2") |
gl2min_mippowf | 0028: the gamma-correct mipmaps with a powf per texel channel (the same bytes, more CPU at loads and joins) |
gl2min_md3pack | 0029 (opt-in): animated MD3 frames in 12 bytes a vertex instead of 20 (the demo's model VBOs 62 -> 37.5 MB of VRAM; 8-bit normals: on llvmpipe 1734 pixels of 30 frames differ by at most 2 levels) |
scan | 0011: R_FindShader scanned the whole shader text again after a miss in its hash table |
crc | 0012: crc32 of every pk3 entry read (nobody looks at the result) |
noaltivec | 0013: the AltiVec versions of the MD3 interpolation and the diffuse lighting (needs the -maltivec build) |
markclear | 0014: two 272-byte memsets for every plane a decal triangle is clipped against |
sndeager | 0015: the sounds of a player model read and decoded when the player joins instead of at their first play |
zlib | 0016: zlib instead of libdeflate for the pk3 entries |
huffslow | 0018: the message Huffman trees fed 1053340 symbols at the first message (a command line cvar: the first message comes before autoexec.cfg) |
up | all of them as before (not the build flags, nor the AltiVec code being compiled in) |
mergelm1 | Batching (ioquake3 0019-0022, gamedb/engines/ioquake3/technical.md): fewer GL calls and draws a frame from renderergl1. On llvmpipe forced to GL 2.1 the demo went from 3022 GL calls and 198 draws a frame to 377 and 79, the same picture (atlas: 74 pixels differ by at most 2). Each variant turns one change back to upstream, allbatchoff all four. 0019: the map's 32 lightmaps as one atlas texture, so a texture lit from several lightmaps is one batch (world batches 114 -> 27 a frame). Off by default since 0024: on the PS3 any atlas page adds ~10 s of hitches per run (stall_s 34-36 vs 24), the frame cost equal. mergelm1 turns it back on. |
glcache0 | 0020: texture unit, GL_TEXTURE_2D and client array state sent at every call (not only when a draw needs a change) |
lockarrays | 0021: glLockArraysEXT/glUnlockArraysEXT around every batch (Mesa only records the range) |
skystrips | 0022: the sky box as a glBegin strip per row, a call per vertex (the demo shows no sky: expect no change here; islanddm drops from ~1450 sky calls a frame to 18) |
allbatchoff | - |
keepimg0 | Loads during play (ioquake3 0025-0026, docs/STALLS.md "OpenArena"). Five bots join the demo, one every 200 frames (bot_minplayers, and qagame's loaddefered makes the cgame load each at once): 3 models, 3 skins, 3-6 textures each, 4 stalls of 130-400 ms a pass on the PS3; and every pass reloads the map: 3 load-screen stalls of 340/700/380 ms (402 image files read, decoded, DXT on the PPE), 10 of the run's 17.6 s of stalls (bench/analysis/passsplit.py tells the two apart). Both switches are on in base (llvmpipe: picture identical over three passes; the second pass on loads nothing during the demo, the reload 0.46 -> 0.17 s). The first pass still loads them (unmeasured). 0025: r_keepImages 0, every texture freed and its file loaded again at each map load |
preload0 | 0026: cl_preloadLate 0, the joining players' models and skins loaded when they join |
loads0 | - |
defer | 0026 (opt-in, changes the picture): loaddefered ignored, the bots keep a substitute model (the demo player's) for the whole demo: what the joins cost against no player loads at all |
mergelm2 | (Before 0024 the atlas was the default and the variant was mergelm0; the notes below were measured that way, "base" there is the atlas on, "mergelm0" the atlas off.) The atlas's ~5% (ps3.362 on Mesa ps3.299) is not in the frames: the window's frames of 100 ms or less render at the same rate with and without it (report.py smooth: 64.0-64.3 fps both ways), the loss is stall time (stall_s 37-45 s with it, 30-37 without). 0023 separates the atlas textures from the batching. mergelm2: the atlas pages with a batch per lightmap (199 draws, the order of mergelm0): stalls as base = the big page's memory, as mergelm0 = the batching. lmsize512 / lmsize256: pages of up to 16 / 4 lightmaps (92 / 132 draws, 1 MB / 256 KB uploads). |
lmsize512 | - |
lmsize256 | - |
tc1nowm | tc1 with no window manager, as step 0 ran: the window never reached the screen (SDL's fullscreen went unanswered), so this measures what showing the frames costs |
allog | - |
b16 | - |
f44 | - |
b16f44 | - |
p1024 | - |
alnull | - |
f32 | - |
lin | - |
nosound | - |
rgbspu | DXT1 of RGB sources (libspeq 2026-10-18, packages/walnut/tools/ps3-spu/doc/dxt-rgb.md): an RGB source (3 bytes a pixel, "speq: s3tc dxt1 ... comps 3" lines) used to be encoded on the PPE (165 ms for a 1024x1024, 43 ms for a 512x512: hitches when a texture loads mid-demo); now the SPEs take it. rgbppe sends RGB back to the PPE encoder (the old behaviour), rgbspu is the default with the same logging, so the pair differs in the switch alone. opengl1 uploads its opaque textures as GL_RGBA data (RGBA DXT1, comps 4), so count the comps 3 lines in game.log first: without them the pair measures nothing. |
rgbppe | - |
One table, a header row per batch (what it tested and what came out). Conditions: what a variant adds to the recipe (its environment switches) and what ran alongside (the stall recorder, a profiler); a column appears only when this game has a value in it. Rows marked invalid or not comparable say why.
What the run length means
"warm-up + 120 s" is a steady-state run, which leaves out a 60 s warm-up and measures 120 s or more; "whole run" counted everything from the start, the way runs before 2026-10-17 did.
| Variant | Conditions | Steady fps in the window |
1% low fps |
Stalls frames over 100 ms |
fps whole run |
Build | Run length | ram free MiB | vram MiB | stall play s seconds | longest play ms ms | sound faults per min faults a minute | cpu seconds | underruns underruns | longest ms ms | stall disk s seconds | stall swap s seconds | stall reclaim s seconds | stall gpu s seconds | stall cpu s seconds |
Note |
|---|---|---|---|---|---|---|---|---|---|---|---|---|---|---|---|---|---|---|---|---|---|
Suite summary
2026-10-20 · suite-summary-2026-10
Tested: Not a test run: the suite's 13 benchmarked games (15 rows, with OpenArena's two renderers and OpenTTD's two blitters) gathered with their known numbers as of October 2026, each value naming the batch or document it came from. Result: It is the calibration of the rating formula (rules 1): the scale was tried on these numbers before any game was rated, and the GameDB calibration table is generated from it. Benchmarks never give a medal; medals come from played sessions only. | |||||||||||||||||||||
| OpenArena, opengl1 | the recipe as it is | 70.6 | 34.6 | - | - | - | warm-up + 120 s | 26 | 39 | 0.0 | 56 | 0 | - | - | - | - | - | - | - | - | right, right |
| OpenArena, opengl2 | the recipe as it is | 60.4 | 25.6 | - | - | - | warm-up + 120 s | 15 | 119 | 0.2 | 199 | 0 | - | - | - | - | - | - | - | - | right, right |
RT mixer: RTPRIO=10 against RTPRIO=0 (OpenAL's mixer on SCHED_RR) on OpenArena, Yamagi Quake II and Luanti base x3 (kernel .874)
2026-10-28 · 2026-10-28-rtprio-openal
Tested: Whether letting OpenAL's mixer thread run at real-time priority (SCHED_RR, allowed by a priority limit of 10) prevents sound dropouts in OpenArena, Yamagi Quake II and Luanti, three rounds. Result: No gain: there were no audible dropouts with or without it, and it cost a little frame rate. Not shipped. What we saw18 runs, rounds alternating the order, none interfered. Every run fullscreen at 1920x1080, with a screenshot 40 s after the load.
| |||||||||||||||||||||
base |
real-time priority 0 | 68.5 | 40.4 | 0 | 62.5 | - | warm-up + 120 s | - | - | 0.0 | 39.6 | - | 143.8 | 0 | 645.7 | - | - | - | - | - | |
base |
real-time priority 10 | 68.3 | 40.1 | 0 | 62.5 | - | warm-up + 120 s | - | - | 0.0 | 43.5 | - | 156.6 | 0 | 700.8 | - | - | - | - | - | |
batch ssdroot12 snd_ps3 DMA watchdog (kernel local/0047): dma_watchdog_ms=200 against 0 (off) on SuperTuxKart lean, OpenArena gl2min and ClassiCube base x3 (SSD root .472 Mesa ps3.545~dev, .472 with the test module)
2026-10-20 · 2026-10-20-ssdroot12-dma-watchdog
Tested: Whether the new snd_ps3 DMA watchdog (kernel patch 0047, which restarts the sound card's DMA when it stalls for 200 ms) prevents the OpenAL wedge, against the watchdog off, on SuperTuxKart, OpenArena and ClassiCube, three rounds. Result: Yes: with it off 2 of 9 runs wedged; with it on none did, two stalls were caught and restarted, and the sound kept going. Frame rates were equal. The watchdog stays on by default in the kernels since. What we saw18 runs rotated with system dumps on; one OpenArena run with the watchdog off was interfered by two logins and left out.
| |||||||||||||||||||||
gl2min |
stall recorder at 10 ms | 61.9 | 28.1 | 1 | 48.7 | Kernel ps3.472, Mesa ps3.545~dev | warm-up + 120 s | 18.9 | 117.0 | 0.2 | 148.7 | - | 212.1 | 0 | 3076.0 | 1.1 | 0.2 | 1.0 | 0.5 | 39.0 | |
gl2min |
stall recorder at 10 ms switch snd_dma_watchdog_ms0 |
62.3 | 28.1 | 0.5 | 48.8 | Kernel ps3.472, Mesa ps3.545~dev | warm-up + 120 s | 16.4 | 116.9 | 0.1 | 139.2 | - | 191.7 | 0.0 | 21436.5 | 0.8 | 2.6 | 1.0 | 0.3 | 26.9 | |
batch ssdroot11 Mesa 0044: NV30_MINMAX_VMX=1 against unset on Sauerbraten base and OpenArena gl2min x3 (SSD root .472 Mesa ps3.545~dev)
2026-10-20 · 2026-10-20-ssdroot11-minmax-vmx
Tested: Whether Mesa 0044 (the AltiVec index scan) helps or hurts games other than SuperTuxKart: BananaBread and OpenArena opengl2, three rounds. Result: Neutral in both (39.37 against 39.64 fps, 61.7 against 62.7), as their draws rarely run the scan. 0044 only pays where those loops run, in SuperTuxKart. What we saw12 runs rotated, none interfered.
| |||||||||||||||||||||
gl2min |
stall recorder at 10 ms | 62.7 | 28.2 | 2 | 48.2 | Kernel ps3.472, Mesa ps3.545~dev | warm-up + 120 s | 19.2 | 117.0 | 0.3 | 192.6 | - | 184.1 | 0 | 3211.0 | 1.0 | 0.3 | 1.7 | 0.4 | 32.1 | |
gl2min |
stall recorder at 10 ms switch minmax_vmx1 |
61.7 | 26.9 | 1 | 48.6 | Kernel ps3.472, Mesa ps3.545~dev | warm-up + 120 s | 17.0 | 116.6 | 0.1 | 143.3 | - | 185.0 | 0 | 3222.0 | 1.1 | 0.5 | 1.2 | 0.4 | 31.2 | |
batch ssdroot9 Mesa 0041: NV30_FENCE_WORK_KICK=1024 against unset on OpenArena gl2min x5 (SSD root .472 Mesa ps3.545~dev)
2026-10-20 · 2026-10-20-ssdroot9-fence-work-kick
Tested: A larger repeat (five rounds) of Mesa 0041 at 1024 on OpenArena opengl2, after the first test's +5% fell inside the noise. Result: Neutral: 62.9 against 62.0 fps (+1.5%), the same 1% low and no CPU saving. The switch stays off. What we saw10 runs rotated, none interfered.
| |||||||||||||||||||||
gl2min |
stall recorder at 10 ms | 62.0 | 27.8 | 1 | 49.7 | Kernel ps3.472, Mesa ps3.545~dev | warm-up + 120 s | 16.2 | 117.0 | 0.2 | 172.4 | - | 191.7 | 0 | 3202.0 | 1.3 | 0.4 | 1.3 | 0.4 | 31.9 | |
gl2min |
stall recorder at 10 ms switch fence_work_kick1024 |
62.9 | 28.2 | 2 | 49.8 | Kernel ps3.472, Mesa ps3.545~dev | warm-up + 120 s | 19.9 | 119.5 | 0.3 | 165.8 | - | 209.7 | 0 | 3166.0 | 0.9 | 0.8 | 1.4 | 0.5 | 38.2 | |
batch ssdroot8 DUMPON=1 repro of the OpenAL wedge: SuperTuxKart x4 OpenArena x3 ClassiCube x3 (SSD root .472 Mesa ps3.545~dev, stock snd_ps3)
2026-10-20 · 2026-10-20-ssdroot8-openal-wedge
Tested: Another reproduction of the OpenAL wedge with system dumps, on SuperTuxKart, OpenArena and ClassiCube, with the stock snd_ps3 sound driver. Result: The real wedge (OpenAL waiting on a sound card that stopped) hit 3 of 10 runs: 2 of 4 SuperTuxKart, 0 of 3 OpenArena and 1 of 3 ClassiCube. In one, the card's position had stood still for a second before, as in the first count. The other dumps caught short underruns that recovered; investigation runs, not for comparison. What we sawInvestigation runs, not for fps: a dump freezes the game for seconds. Only runs without a dump have numbers, not comparable with other batches. Webcam picture right in all 10; dumps in 8 of 10.
| |||||||||||||||||||||
gl2min |
stall recorder at 10 ms | 61.6 | 27.1 | 3 | 20.1 | Kernel ps3.472, Mesa ps3.545~dev | warm-up + 120 s | 16.0 | 116.9 | 0.4 | 129.7 | - | 176.2 | 0 | 3773.0 | 1.1 | 2.5 | 1.2 | 0.4 | 31.0 | |
batch ssdroot8 Mesa 0038 force-DXT on the rest of the suite: Luanti and ClassiCube off/opaque/opaque+NEAREST, OpenArena gl2min and gl2min_tc0 off/opaque, SuperTuxKart lean opaque/all (SSD root .472 Mesa ps3.545~dev)
2026-10-20 · 2026-10-20-ssdroot8-force-dxt
Tested: Whether Mesa 0038's forced texture compression (opaque textures to DXT1, or every texture with 'all') saves VRAM in the rest of the suite: Luanti, ClassiCube, OpenArena and SuperTuxKart. Result: Only SuperTuxKart with 'all' changed anything: 182 textures went to DXT5 and peak VRAM fell from 95.5 to 58.1 MiB (-39%) at the same frame rate, with no difference visible on the webcam. The other games compressed nothing, because their uploads are empty textures filled later, small, or in formats the switch skips. No decision recorded; the user has the last word on the picture. What we saw24 runs, compression statistics on in every arm, none interfered, webcam picture right in all.
| |||||||||||||||||||||
gl2min |
stall recorder at 10 ms switch force_dxt_stats50 |
61.8 | 27.2 | 2.0 | 48.2 | Kernel ps3.472, Mesa ps3.545~dev | warm-up + 120 s | 13.4 | 115.3 | 0.3 | 160.7 | - | 187.2 | 0.0 | 3206.0 | 1.6 | 1.4 | 1.4 | 0.5 | 32.0 | |
gl2min |
stall recorder at 10 ms switch force_dxtopaque_force_dxt_stats50 |
62.1 | 27.8 | 1.5 | 49.1 | Kernel ps3.472, Mesa ps3.545~dev | warm-up + 120 s | 17.4 | 117.0 | 0.2 | 159.3 | - | 201.7 | 0.0 | 3228.5 | 1.5 | 1.3 | 1.5 | 0.4 | 31.8 | |
gl2min_tc0 |
stall recorder at 10 ms switch force_dxt_stats50 |
58.6 | 25.6 | 3.0 | 46.4 | Kernel ps3.472, Mesa ps3.545~dev | warm-up + 120 s | 19.8 | 146.8 | 0.6 | 298.8 | - | 187.5 | 0.0 | 3498.0 | 1.1 | 0.6 | 1.5 | 0.1 | 31.1 | |
gl2min_tc0 |
stall recorder at 10 ms switch force_dxtopaque_force_dxt_stats50 |
58.9 | 25.4 | 3.0 | 47.3 | Kernel ps3.472, Mesa ps3.545~dev | warm-up + 120 s | 19.1 | 148.2 | 0.5 | 163.6 | - | 185.9 | 0.0 | 3227.0 | 1.1 | 1.1 | 1.3 | 0.1 | 30.9 | |
batch ssdroot7 DUMPON=1 repro of the OpenAL wedge: SuperTuxKart x4 OpenArena x3 ClassiCube x3 Sauerbraten x3 (SSD root .472 Mesa ps3.545~dev)
2026-10-19 · 2026-10-19-ssdroot7-openal-wedge
Tested: How often OpenAL's sound output wedges (stops) in four games, with a full system dump taken the moment it happens, to find the cause. Result: The wedge hit 3 of 4 SuperTuxKart runs, 1 of 3 OpenArena, 1 of 3 ClassiCube and none of 3 BananaBread, as early as 21 s in. The dumps showed the sound card's DMA stopping in the kernel's snd_ps3 driver. Investigation runs: their numbers are not for comparison. What we sawInvestigation runs, not for fps: a dump freezes the game for seconds, and the dump mode itself costs (OpenArena's window was 71 s at 57 fps against 94 s at 62 fps without it). Only the 8 of 13 runs without a dump have numbers, and they are not comparable with other batches.
| |||||||||||||||||||||
gl2min |
stall recorder at 10 ms | 57.0 | 25.2 | 0.0 | 47.0 | Kernel ps3.472, Mesa ps3.545~dev | warm-up + 120 s | 21.1 | 117.0 | 0.0 | 91.2 | - | 185.9 | 0.0 | 3337.0 | 1.6 | 0.1 | 1.6 | 0.5 | 31.8 | |
batch ssdroot6 Mesa 0041: NV30_FENCE_WORK_KICK=1024 and =0 against unset on OpenArena gl2min x3 (SSD root .472 Mesa ps3.545~dev)
2026-10-19 · 2026-10-19-ssdroot6-fence-work-kick
Tested: Whether Mesa 0041 (fewer GPU submissions for deferred frees: only once 1024 are queued, or never with 0) saves CPU and frames in OpenArena opengl2, whose profile spent 12.5% there; three arms against the switch unset. Result: Not proven: 1024 gave 65.4 fps against 62.3 unset, inside the spread, and the CPU time did not fall (the profile had promised about 10%). After a five-round repeat the switch stays off. What we saw9 runs rotated over three arms: unset, 1024 and 0. Webcam picture right in all.
| |||||||||||||||||||||
gl2min |
stall recorder at 10 ms | 62.3 | 28.1 | 0.0 | 50.0 | Kernel ps3.472, Mesa ps3.545~dev | warm-up + 120 s | 15.6 | 117.0 | 0.0 | 63.8 | - | 211.9 | 0.0 | 3142.5 | 1.1 | 0.8 | 0.6 | 0.5 | 32.1 | |
gl2min |
stall recorder at 10 ms switch fence_work_kick0 |
63.2 | 28.9 | 0 | 51.9 | Kernel ps3.472, Mesa ps3.545~dev | warm-up + 120 s | 16.5 | 119.6 | 0.0 | 81.8 | - | 216.5 | 0 | 3079.0 | 0.7 | 0.4 | 0.6 | 0.6 | 39.3 | |
gl2min |
stall recorder at 10 ms switch fence_work_kick1024 |
65.3 | 29.5 | 0.5 | 52.2 | Kernel ps3.472, Mesa ps3.545~dev | warm-up + 120 s | 14.4 | 119.5 | 0.1 | 97.7 | - | 222.2 | 0.0 | 3147.5 | 1.0 | 0.8 | 0.6 | 0.6 | 39.5 | |
batch ssdroot6 libpng: libpng16 1.6.59 +ps3.560 against Debian's stock on SuperTuxKart lean x3 and Sauerbraten base x3 and OpenArena gl2min x2 (SSD root .472 Mesa ps3.545~dev zlib-ng on both arms)
2026-10-19 · 2026-10-19-ssdroot6-libpng
Tested: Whether our libpng (1.6.59 +ps3.560) cuts load times against Debian's, mainly on SuperTuxKart, whose load profile showed 4 s of PNG decoding; BananaBread and OpenArena as controls, zlib-ng on in both arms. Result: Yes for SuperTuxKart: PNG decoding in the load fell from 4.0 to 1.6 s (-60%, as predicted) and the whole load from 30.3 to 27.6 s (-9%), with gameplay unchanged. Nothing measurable for BananaBread and OpenArena. Our libpng later replaced Debian's on the PS3. What we sawWebcam picture right in all runs.
| |||||||||||||||||||||
gl2min |
stall recorder at 10 ms switch zng |
61.1 | 27.4 | 0.0 | 51.0 | Kernel ps3.472, Mesa ps3.545~dev | warm-up + 120 s | 14.4 | 117.2 | 0.0 | 71.7 | - | 211.6 | 0.0 | 3154.0 | 1.0 | 0.8 | 0.6 | 0.4 | 32.5 | |
gl2min |
stall recorder at 10 ms switch zng switch ldstock-png |
63.0 | 28.6 | 0.0 | 50.5 | Kernel ps3.472, Mesa ps3.545~dev | warm-up + 120 s | 16.4 | 117.0 | 0.0 | 65.5 | - | 235.5 | 0.0 | 3117.5 | 0.7 | 0.4 | 0.7 | 0.5 | 39.1 | |
batch ssdroot5 OpenAL: the new openal-soft +ps3.549 against Debian's stock (LDPATH) and int16 against float output (OAL=f32) on OpenArena gl2min and ClassiCube base x3 (SSD root .472 Mesa ps3.544)
2026-10-19 · 2026-10-19-ssdroot5-openal
Tested: Whether our rebuilt OpenAL library (openal-soft +ps3.549) is faster than Debian's, and whether 16-bit integer output beats float output, on OpenArena (opengl2) and ClassiCube, three rounds. Result: Our library gave OpenArena about 2% (57.3 against 56.3 fps) and left ClassiCube unchanged, as that game is limited by the GPU. Integer against float output made no difference beyond the noise. Our library later replaced Debian's on the PS3 as the default. What we saw24 runs rotated, four arms per game: our library or Debian's, each with integer or float output.
| |||||||||||||||||||||
gl2min |
stall recorder at 10 ms | 57.2 | 25.2 | 0 | 46.2 | Kernel ps3.472, Mesa ps3.544 | warm-up + 120 s | 16.3 | 117.0 | 0.0 | 93.2 | - | 183.7 | 0 | 3350.0 | 1.2 | 0.8 | 1.3 | 0.4 | 31.7 | |
gl2min |
stall recorder at 10 ms switch ldstock-openal |
56.2 | 23.5 | 3 | 45.0 | Kernel ps3.472, Mesa ps3.544 | warm-up + 120 s | 17.7 | 117.0 | 0.4 | 200.7 | - | 194.1 | 0 | 3241.0 | 1.1 | 0.5 | 1.5 | 0.5 | 31.8 | |
gl2min |
stall recorder at 10 ms switch oalf32 |
56.8 | 25.0 | 2 | 46.2 | Kernel ps3.472, Mesa ps3.544 | warm-up + 120 s | 17.4 | 116.9 | 0.3 | 177.9 | - | 186.4 | 0 | 3364.0 | 0.9 | 0.4 | 1.5 | 0.5 | 31.6 | |
gl2min |
stall recorder at 10 ms switch oalf32 switch ldstock-openal |
56.9 | 24.4 | 0 | 46.8 | Kernel ps3.472, Mesa ps3.544 | warm-up + 120 s | 19.2 | 117.0 | 0.0 | 85.4 | - | 190.3 | 0 | 3207.0 | 0.9 | 0.4 | 1.1 | 0.5 | 31.9 | |
batch ssdroot5 Mesa 0040: NV30_STAGING_POOL_MB=24 against off on ClassiCube base and OpenArena gl2min x3 (SSD root .472 Mesa ps3.544)
2026-10-19 · 2026-10-19-ssdroot5-staging-pool
Tested: Whether Mesa 0040's staging pool changes anything, good or bad, in games that don't upload big textures every frame: ClassiCube and OpenArena (opengl2), three rounds. Result: No change and no regression, as expected: the pool only handles uploads over 256 KiB. What we saw12 runs.
| |||||||||||||||||||||
gl2min |
stall recorder at 10 ms | 57.6 | 25.8 | 1 | 47.7 | Kernel ps3.472, Mesa ps3.544 | warm-up + 120 s | 16.9 | 117.2 | 0.2 | 205.4 | - | 183.8 | 0 | 3327.0 | 1.3 | 0.6 | 1.5 | 0.4 | 31.3 | |
gl2min |
stall recorder at 10 ms switch staging_pool_mb24 |
57.0 | 24.7 | 2 | 45.8 | Kernel ps3.472, Mesa ps3.544 | warm-up + 120 s | 16.1 | 116.9 | 0.3 | 190.0 | - | 183.8 | 0 | 3166.0 | 1.2 | 0.3 | 1.5 | 0.5 | 31.5 | |
batch ssdroot2 P2: Mesa 0038 NV30_FORCE_DXT=opaque against off (MEM=1 STALLS=1 NV30_FORCE_DXT_STATS=50)
2026-10-19 · 2026-10-19-ssdroot2-force-dxt
Tested: Mesa 0038, a switch that compresses opaque textures to DXT on upload to save VRAM, against off on BananaBread, SuperTuxKart and OpenArena. Result: In BananaBread it cuts peak VRAM from 119.8 MB (the cap) to 73-78 MB with no frame rate change and a slightly softer picture. It compresses nothing in SuperTuxKart and OpenArena, whose textures it skips, so no effect there. What we saw
| |||||||||||||||||||||
gl2min |
stall recorder at 10 ms switch force_dxt_stats50 |
56.3 | 23.0 | 0.0 | 45.2 | - | warm-up + 120 s | 14.9 | 117.3 | 0.0 | 88.5 | - | 199.2 | 0.0 | 3254.0 | 1.2 | 0.6 | 2.0 | 0.5 | 31.8 | |
gl2min |
stall recorder at 10 ms switch force_dxtopaque_force_dxt_stats50 |
55.8 | 22.9 | 3.0 | 45.0 | - | warm-up + 120 s | 19.8 | 116.9 | 0.4 | 191.4 | - | 197.5 | 0.0 | 3157.5 | 1.1 | 0.2 | 1.6 | 0.6 | 31.6 | |
batch ssdroot2 P1b: gameplay profiles on the SSD root (PERF=1 MEM=1 x1)
2026-10-19 · 2026-10-19-ssdroot2-gameplay-profiles
Tested: Where the CPU goes during play in seven games on the SSD root, profiled with perf over the measured window. Result: Mesa is the biggest share in BananaBread (62.8%) and ClassiCube, the game itself in SuperTuxKart, OpenArena and Luanti, and OpenTTD spends half its time in the kernel. Profiled runs, not for frame rates; OpenTTD was profiled at its title screen, not in play. What we saw
not comparable gameplay profiles (PERF=1 MEM=1), slower than plain runs. | |||||||||||||||||||||
gl2minnot comparable |
perf recording | 56.0 | 24.3 | 0 | 46.5 | - | warm-up + 120 s | 19.6 | 116.4 | 0.0 | 86.9 | - | 203.4 | 0 | 3265.0 | - | - | - | - | - | |
batch ssdroot2 P1a: start-up profiles on the SSD root (PERF_LOAD=1 STALLS=1 x1)
2026-10-19 · 2026-10-19-ssdroot2-startup-profiles
Tested: Where the start-up time goes now that the system runs from the SSD: one profiled start of each of five games, from a cold cache. Result: Loads are 39-61% shorter than on USB and are now mostly CPU work on the main thread (47-77%), with the disk only 13-26%. The biggest remaining costs are named per game (map inflate, PNG and zlib decoding, Luanti's map generation). Profiled runs, not for frame rates. What we saw
not comparable start-up profiles (PERF_LOAD=1 STALLS=1), slower than plain runs. | |||||||||||||||||||||
gl2minnot comparable |
stall recorder at 10 ms start-up profile |
64.9 | 27.6 | 2 | 47.7 | - | warm-up + 120 s | 16.4 | 117.2 | 0.2 | 131.2 | - | 202.9 | 0 | 3346.0 | 1.3 | 0.3 | 2.1 | 0.6 | 38.7 | |
batch ssdroot1+2 A: baseline on the SSD root (kernel .472 Mesa .476 ps3rsx 0.443 ps3-gpu-tools 0.477~dev)
2026-10-19 · 2026-10-19-ssdroot1-baseline
Tested: A new baseline with the whole system running from the internal SSD instead of a USB disk, on five games, to see what it does to loads, stalls and frame rates. This console has an upgraded SSD; a stock PS3 has a hard disk. Result: Loads are 35-58% shorter (BananaBread 16.9 to 7.1 s, SuperTuxKart 53.6 to 31.1 s) and BananaBread's gameplay stalls almost vanish, while frame rates stay about the same apart from OpenArena (55.9 to 60.4). It also showed SuperTuxKart's own "Average FPS" is its physics tick rate, so its fps is taken from the HUD from here on. What we saw
| |||||||||||||||||||||
gl2min |
stall recorder at 10 ms | 60.4 | 25.6 | 1 | 48.8 | Kernel ps3.472, Mesa ps3.476, ps3rsx 0.443 | warm-up + 120 s | 15.3 | 116.3 | 0.2 | 199.3 | - | 194.4 | 0 | 3332.0 | 1.1 | 0.2 | 1.5 | 0.6 | 31.4 | |
batch ssd1: SSD game data and SSD swap spill against the USB disk (Sauerbraten base x3, OpenArena gl2min)
2026-10-18 · 2026-10-18-ssd1
Tested: Whether putting game data, and also the swap overflow, on an SSD instead of the USB disk shortens loads and stalls in BananaBread and OpenArena. Result: Game data alone on the SSD leaves BananaBread unchanged, because its binaries, libraries and shader cache still load from USB. OpenArena loads 28% faster, but with too few runs to be more than indicative. What we saw
| |||||||||||||||||||||
gl2min |
stall recorder at 10 ms | 55.9 | 23.1 | 3.0 | 36.5 | - | warm-up + 120 s | 13.4 | 117.2 | 0.3 | 111.1 | - | 197.0 | 0.0 | 4750.0 | 4.3 | 0.3 | 1.5 | 0.6 | 31.4 | |
gl2min |
stall recorder at 10 ms switch gdssd |
56.1 | 23.5 | 0 | 39.7 | - | warm-up + 120 s | 11.8 | 117.2 | 0.0 | 95.9 | - | 196.2 | 0 | 3650.0 | 3.9 | 0.5 | 1.3 | 0.4 | 31.6 | |
gl2min |
stall recorder at 10 ms switch gdssd switch swssd |
56.1 | 24.4 | 1 | 42.4 | - | warm-up + 120 s | 14.1 | 117.2 | 0.1 | 105.2 | - | 195.7 | 0 | 3500.0 | 5.3 | 0.2 | 1.3 | 0.6 | 31.3 | |
batch 17: ETR uncapped, start-up profiles x5, shader cache cold/warm, OpenArena gl2 memory variants, Mesa sysmem switches, Sauerbraten shortnormals
2026-10-18 · 2026-10-18-batch17
Tested: A mixed batch: ioquake3 462's new colour path and memory variants for OpenArena's OpenGL 2 renderer, Mesa's system-memory copy switches, BananaBread's short normals, a warm shader cache, Extreme Tux Racer without a frame cap, and start-up profiles. Result: ioquake3 462 cuts OpenArena's stalls from 9-11 s to 0.7-2.6 s at 57-60 fps, Mesa's system-memory switches fix the old colour path's stalls, and BananaBread's short normals give +17%. The shader cache gives no faster loads and Extreme Tux Racer's 59 fps is not a vsync cap. What we saw
| |||||||||||||||||||||
gl2min |
stall recorder at 10 ms | 59.5 | 21.9 | 8.0 | 40.5 | - | warm-up + 120 s | 15.2 | 117.1 | 2.4 | 867.7 | - | 200.3 | 0.0 | 5067.5 | 5.6 | 0.9 | 1.8 | 0.5 | 32.0 | |
gl2min |
stall recorder at 10 ms start-up profile |
57.9 | 21.7 | 7 | 40.8 | - | warm-up + 120 s | 15.9 | 116.9 | 1.9 | 896.5 | - | 201.5 | 0 | 4620.0 | 5.8 | 0.2 | 0.9 | 0.6 | 32.3 | |
gl2min |
stall recorder at 10 ms start-up profile switch sccold |
57.6 | 22.5 | 6 | 39.4 | - | warm-up + 120 s | 20.4 | 116.9 | 1.0 | 406.1 | - | 201.6 | 0 | 5068.0 | 6.9 | 0.4 | 1.3 | 0.5 | 32.6 | |
gl2min |
stall recorder at 10 ms start-up profile switch scprime |
57.4 | 22.5 | 4 | 36.6 | - | warm-up + 120 s | 13.9 | 117.2 | 1.1 | 736.6 | - | 201.3 | 0 | 4304.0 | 6.1 | 0.9 | 1.0 | 0.5 | 32.4 | |
gl2min |
stall recorder at 10 ms start-up profile switch scwarm |
55.4 | 22.7 | 5 | 37.6 | - | warm-up + 120 s | 14.1 | 117.2 | 0.7 | 207.5 | - | 199.8 | 0 | 4738.0 | 5.3 | 0.6 | 1.1 | 0.6 | 32.4 | |
gl2min_color16 |
stall recorder at 10 ms | 52.4 | 10.8 | 30.5 | 31.5 | - | warm-up + 120 s | 10.1 | 116.6 | 12.9 | 2023.0 | - | 189.9 | 0.0 | 11122.5 | 7.8 | 20.1 | 4.2 | 0.4 | 23.6 | |
gl2min_color16 |
stall recorder at 10 ms switch invalidate_buffer1_sysmem_copy2_sysmem_stats300 |
59.1 | 22.8 | 8.5 | 39.7 | - | warm-up + 120 s | 16.5 | 117.1 | 1.4 | 383.9 | - | 197.8 | 0.0 | 4838.5 | 6.6 | 0.9 | 2.1 | 0.5 | 31.6 | |
gl2min_color16 |
stall recorder at 10 ms switch sysmem_stats300 |
53.7 | 13.9 | 22.0 | 31.2 | - | warm-up + 120 s | 10.4 | 115.3 | 11.1 | 3119.0 | - | 187.0 | 0.0 | 12139.5 | 7.8 | 22.9 | 4.5 | 0.5 | 22.7 | |
gl2min_md3pack |
stall recorder at 10 ms | 59.0 | 23.5 | 4.0 | 40.2 | - | warm-up + 120 s | 16.6 | 97.7 | 1.3 | 943.4 | - | 208.8 | 0.0 | 6304.0 | 6.6 | 1.0 | 1.8 | 0.4 | 35.8 | |
gl2min_mippowf |
stall recorder at 10 ms | 60.0 | 23.6 | 4.5 | 39.5 | - | warm-up + 120 s | 11.7 | 117.2 | 0.8 | 368.3 | - | 215.0 | 0.0 | 5718.0 | 3.8 | 0.8 | 1.9 | 0.6 | 41.2 | |
batch 16: game prefetch A/B, idle fix on/off (433), ClassiCube chunks1, X-Moto stream, Luanti lean parts
2026-10-18 · 2026-10-18-batch16
Tested: Several checks on kernel .433: a game-data prefetch, the idle-CPU fix on and off, ClassiCube's chunk setting, X-Moto's streaming draw path, and the parts of Luanti's lean settings one at a time. Result: The prefetch gives no gain and makes Luanti worse, so it was turned off by default. The idle fix is confirmed clean (gameplay stalls 0.4 s against 8-9 s); ClassiCube's chunk setting gains 4.7% and X-Moto's streaming 1%. Luanti's chunk size 3 is what empties the world in lean. What we saw
| |||||||||||||||||||||
base |
the recipe as it is | 66.1 | 33.5 | 8.0 | 56.1 | - | warm-up + 120 s | 27.6 | 39.3 | 4.2 | 1267.5 | - | 187.8 | 0.0 | 1478.7 | - | - | - | - | - | |
gl2min |
stall recorder at 10 ms | 51.8 | 14.8 | 20 | 30.6 | - | warm-up + 120 s | 9.5 | 117.2 | 11.0 | 2038.0 | - | 194.9 | 0 | 10783.0 | 6.8 | 20.1 | 3.1 | 0.4 | 28.9 | |
gl2min |
stall recorder at 10 ms switch gpffetch |
53.1 | 15.5 | 18 | 31.4 | - | warm-up + 120 s | 9.1 | 117.2 | 10.4 | 1782.0 | - | 195.2 | 0 | 13510.0 | 8.8 | 17.8 | 3.0 | 0.4 | 28.9 | |
kernel 6.12.111+ps3.419 idle fix on/off (OpenArena ioquake3 379, no kicker)
2026-10-18 · 2026-10-18-kernel-419-idle
Tested: Kernel 6.12.111+ps3.419's fix for the late wake-ups of an idle CPU, switched on and off in OpenArena without the stopgap kicker. Result: With the fix the gameplay stalls drop to 0.1-0.5 s from 5.6-8.2 s without it. A stuck polling loop logged into the PS3 during all four runs, so the absolute numbers are not clean; the result was confirmed clean in batch 16. What we saw
| |||||||||||||||||||||
base |
the recipe as it is | 66.8 | 30.9 | 7.0 | 50.8 | Kernel ps3.419 | warm-up + 120 s | 42.9 | 36.6 | 3.0 | 633.6 | - | 183.3 | 0.0 | 1352.7 | - | - | - | - | - | |
batch 8: STK lean, OpenTTD gl, ClassiCube/dsda batching, malloc presets, profiles (Mesa ps3.408, kick)
2026-10-18 · 2026-10-18-batch8
Tested: A mixed batch: SuperTuxKart's lean settings, OpenTTD's OpenGL driver, draw batching in ClassiCube and dsda-doom, memory allocator presets, and profiles of OpenArena and Luanti. Result: SuperTuxKart lean runs 21.4 fps against 13 with far fewer stalls, OpenTTD's GL driver doubles its frame rate, dsda-doom's batching gains 3% while ClassiCube's loses 4%, and the allocator presets were noise. One Luanti profiling run was disturbed by a mouse click. What we saw
| |||||||||||||||||||||
base |
waker kick at 10 ms | 67.8 | 36.9 | 0 | 55.8 | Mesa ps3.408 | warm-up + 120 s | 36.4 | 38.0 | 0.0 | 72.5 | - | 121.9 | 0.0 | 669.7 | - | - | - | - | - | |
base |
waker kick at 10 ms switch mmmap |
70.8 | 37.2 | 0 | 56.9 | Mesa ps3.408 | warm-up + 120 s | 30.9 | 39.3 | 0.0 | 90.1 | - | 134.4 | 0.0 | 619.1 | - | - | - | - | - | |
base |
waker kick at 10 ms switch mtrim |
70.9 | 36.6 | 1 | 56.1 | Mesa ps3.408 | warm-up + 120 s | 26.4 | 36.2 | 0.1 | 112.2 | - | 136.1 | 0.0 | 938.4 | - | - | - | - | - | |
gl2min |
waker kick at 10 ms perf recording |
53.4 | 13.5 | 27 | 30.0 | Mesa ps3.408 | warm-up + 120 s | 9.7 | 114.7 | 54.7 | 16148.0 | - | 201.8 | 0 | 16148.0 | - | - | - | - | - | |
ioquake3 ps3.396 (r_keepImages + cl_preloadLate), libspeq 0.394 (RGB DXT on SPEs), Mesa ps3.408 default LUT; recorder + kick
2026-10-18 · 2026-10-18-ioquake3-396
Tested: ioquake3 ps3.396, which keeps loaded images and preloads the late-loading ones so OpenArena stops loading in the middle of the demo; also libspeq 0.394's RGB texture compression on the SPUs, on BananaBread. Result: OpenArena's gameplay stalls go from 9-10 s to none and the steady rate rises from about 65 to 70.6 fps. BananaBread shows no difference because its demo uploads no RGB textures to compress; on its own the SPU compressor is far faster than the PPE. What we saw
| |||||||||||||||||||||
base |
stall recorder at 10 ms waker kick at 10 ms |
70.6 | 34.6 | 0.0 | 55.9 | Mesa ps3.408 | warm-up + 120 s | 26.0 | 39.3 | 0.0 | 55.6 | - | 205.1 | 0.0 | 687.7 | 0.1 | 0.0 | 0.1 | 0.2 | 6.0 | |
loads0 |
stall recorder at 10 ms waker kick at 10 ms |
65.2 | 31.0 | 29.0 | 57.1 | Mesa ps3.408 | warm-up + 120 s | 28.9 | 39.4 | 9.4 | 932.2 | - | 205.8 | 0.0 | 1369.5 | 0.8 | 0.0 | 0.6 | 0.2 | 16.6 | |
lost decrementer: wakers (ps3-gpu-tools 0.399), OpenArena ioquake3 379
2026-10-18 · 2026-10-18-lost-decrementer
Tested: Whether OpenArena's stalls come from a CPU timer interrupt that gets lost, so a sleeping thread wakes late: wake-up helpers (ps3-gpu-tools 0.399) compared, including a 10 ms cross-CPU kick. Result: Yes: without a game one CPU woke up to 1.44 s late, never with a 10 ms kick, and the kick halved OpenArena's gameplay stalls. The fix went into the kernel (patch 0009), with the kicker as a stopgap in game mode. What we saw
| |||||||||||||||||||||
base |
the recipe as it is | 56.8 | 28.0 | 38.0 | 51.0 | - | warm-up + 120 s | 27.8 | 39.4 | 14.7 | 2320.0 | - | 181.7 | 0.0 | 2564.5 | - | - | - | - | - | |
base |
probe20 | 57.9 | 21.5 | 39.0 | 51.4 | - | warm-up + 120 s | 23.5 | 39.3 | 13.4 | 1064.5 | - | 171.5 | 0.0 | 1331.0 | - | - | - | - | - | |
base |
stall recorder at 10 ms | 62.7 | 28.1 | 27.5 | 54.3 | - | warm-up + 120 s | 28.5 | 39.4 | 7.9 | 706.0 | - | 194.6 | 0.0 | 1462.5 | 0.8 | 0.0 | 0.3 | 0.2 | 15.4 | |
base |
waker kick at 10 ms | 64.3 | 33.4 | 25.5 | 55.4 | - | warm-up + 120 s | 27.6 | 39.4 | 6.3 | 435.4 | - | 202.7 | 0.0 | 1166.5 | - | - | - | - | - | |
base |
waker sleep at 10 ms | 58.9 | 26.2 | 33.5 | 56.0 | - | warm-up + 120 s | 26.1 | 39.4 | 12.1 | 1272.0 | - | 194.1 | 0.0 | 1902.0 | - | - | - | - | - | |
stall recorder (ps3-gpu-tools 0.385), ioquake3 ps3.379 (atlas off), Sauerbraten demo + nonfree data
2026-10-17 · 2026-10-17-stall-recorder
Tested: The first runs with the stall recorder (ps3-gpu-tools 0.385), which logs why each long frame happened, on OpenArena (ioquake3 ps3.379, atlas off) and BananaBread's demo with its full data. Result: The recorder costs 5.6% of a thread. OpenArena's hitches are CPU work on the main thread (texture and skin loads mid-demo), BananaBread's are disk reads from the USB drive. Fewer OpenArena stalls with the recorder on was left unexplained. What we saw
| |||||||||||||||||||||
base |
the recipe as it is | 57.8 | 8.6 | 69.0 | 49.2 | - | warm-up + 120 s | 26.4 | 39.4 | - | - | - | 183.0 | 0.0 | 2168.5 | 0.0 | 0.0 | 0.1 | 0.2 | 15.6 | |
ioquake3 ps3.378 (0023 atlas variants), Mesa ps3.299
2026-10-17 · 2026-10-17-ioquake3-378-atlas
Tested: Why OpenArena's batching build stutters: variants of the lightmap atlas in ioquake3 ps3.378 (merge off, atlas with the old draws, smaller atlas pages). Result: Any atlas page adds about 10 s of hitches per run; the batching itself does not. The atlas was turned off by default in the next build. What we saw
| |||||||||||||||||||||
base |
the recipe as it is | 57.0 | 6.1 | 87 | 50.5 | Mesa ps3.299 | warm-up + 120 s | 27.9 | 39.3 | - | - | - | 132.3 | 0 | 1843.0 | - | - | - | - | - | |
lmsize256 |
the recipe as it is | 54.4 | 6.2 | 92 | 48.6 | Mesa ps3.299 | warm-up + 120 s | 30.4 | 39.4 | - | - | - | 144.8 | 0 | 3300.0 | - | - | - | - | - | |
mergelm0 |
the recipe as it is | 58.8 | 9.9 | 62 | 52.2 | Mesa ps3.299 | warm-up + 120 s | 27.2 | 39.4 | - | - | - | 180.7 | 0 | 2356.0 | - | - | - | - | - | |
mergelm2 |
the recipe as it is | 55.6 | 5.7 | 88 | 51.7 | Mesa ps3.299 | warm-up + 120 s | 27.4 | 39.4 | - | - | - | 150.8 | 0 | 1737.0 | - | - | - | - | - | |
ioquake3 ps3.362 batching (0019-0022), Mesa ps3.299
2026-10-17 · 2026-10-17-ioquake3-362-batching
Tested: Our ioquake3 ps3.362 with four draw-batching patches (0019-0022) in OpenArena's OpenGL 1 renderer, each switched off in turn to see what it is worth. Result: No gain: with all four on OpenArena runs 51.8 fps against 56.4 with all off. The lightmap atlas (0019) costs about 5% on the GPU even though it saves CPU; the atlas variants were tested next. What we saw
| |||||||||||||||||||||
base |
the recipe as it is | 53.4 | 5.4 | 96 | 49.6 | Mesa ps3.299 | warm-up + 120 s | 28.3 | 39.4 | - | - | - | 130.6 | 0 | 2831.0 | - | - | - | - | - | |
allbatchoff |
the recipe as it is | 56.4 | 7.1 | 86.0 | 50.8 | Mesa ps3.299 | warm-up + 120 s | 24.7 | 39.4 | - | - | - | 182.7 | 0.0 | 2171.0 | - | - | - | - | - | |
glcache0 |
the recipe as it is | 53.6 | 6.3 | 93 | 42.8 | Mesa ps3.299 | warm-up + 120 s | 26.2 | 39.4 | - | - | - | 134.5 | 0 | 4799.0 | - | - | - | - | - | |
lockarrays |
the recipe as it is | 55.4 | 5.7 | 89 | 42.2 | Mesa ps3.299 | warm-up + 120 s | 31.9 | 39.4 | - | - | - | 131.0 | 0 | 2549.0 | - | - | - | - | - | |
mergelm0 |
the recipe as it is | 56.1 | 6.1 | 82 | 47.3 | Mesa ps3.299 | warm-up + 120 s | 32.2 | 39.4 | - | - | - | 159.4 | 0 | 2573.0 | - | - | - | - | - | |
Mesa ps3.299 + ps3rsx 0.249
2026-10-17 · 2026-10-17-mesa-299
Tested: Mesa ps3.299, the third round of driver changes: adaptive submission (0027), a fenced index buffer (0028), state reset (0029), index upload (0030) and fragment-program constants read from system memory (0031). Result: Armagetron gets its frame rate back (50 to 61.5 fps), OpenArena and ClassiCube are unchanged, and X-Moto loses a real 5% that none of the switches fully restores. The picture was right and the driver tests passed. What we saw
| |||||||||||||||||||||
base |
the recipe as it is | - | - | - | 52.3 | Mesa ps3.299, ps3rsx 0.249 | whole run | 26.7 | 38.0 | - | - | - | 38.2 | 0.0 | - | - | - | - | - | - | |
ioquake3 ps3.285 + Mesa ps3.282 + ps3rsx 0.249
2026-10-17 · 2026-10-17-ioquake3-285
Tested: Our ioquake3 build with ten memory patches (0001-0010) for OpenArena's OpenGL 2 renderer, which ran out of memory and stalled for half a minute on the stock build. Result: The patches together take OpenArena's OpenGL 2 renderer from 14.8 fps with a 24.7 s stall to 26-32 fps with a 6 s worst frame, at half the CPU. Patch 0007 (no CPU copy of the model vertices) is the one that matters most. What we saw
| |||||||||||||||||||||
gl2 |
the recipe as it is | - | - | - | 15.9 | Mesa ps3.282, ps3rsx 0.249 | whole run | 11.9 | 138.1 | - | - | - | 62.6 | 0 | - | - | - | - | - | - | |
gl2min |
the recipe as it is | - | - | - | 29.0 | Mesa ps3.282, ps3rsx 0.249 | whole run | 14.0 | 114.1 | - | - | - | 51.8 | 0.0 | - | - | - | - | - | - | |
gl2min_cpuanim |
the recipe as it is | - | - | - | 30.5 | Mesa ps3.282, ps3rsx 0.249 | whole run | 24.1 | 41.2 | - | - | - | 53.1 | 0 | - | - | - | - | - | - | |
gl2min_lean |
the recipe as it is | - | - | - | 28.0 | Mesa ps3.282, ps3rsx 0.249 | whole run | 32.2 | 90.4 | - | - | - | 48.9 | 0 | - | - | - | - | - | - | |
gl2min_modelverts |
the recipe as it is | - | - | - | 17.6 | Mesa ps3.282, ps3rsx 0.249 | whole run | 11.6 | 106.3 | - | - | - | 59.3 | 0 | - | - | - | - | - | - | |
gl2min_up |
the recipe as it is | - | - | - | 14.8 | Mesa ps3.282, ps3rsx 0.249 | whole run | 13.5 | 112.4 | - | - | - | 103.0 | 0 | - | - | - | - | - | - | |
Mesa ps3.282 + ps3rsx 0.249: kick100 against base in OpenArena X-Moto ClassiCube
2026-10-17 · 2026-10-17-mesa-282-kick100
Tested: Whether submitting work to the GPU every 100 draws, which restored Armagetron's frame rate, also helps or hurts OpenArena, X-Moto and ClassiCube. Result: No fixed number of draws suits every game: it gains OpenArena 3%, costs X-Moto 9% and leaves ClassiCube flat but with 9% more CPU. The adaptive submission of Mesa ps3.299 (0027) followed; why X-Moto loses is not established. What we saw
| |||||||||||||||||||||
base |
the recipe as it is | - | - | - | 51.3 | Mesa ps3.282, ps3rsx 0.249 | whole run | 26.5 | 36.6 | - | - | - | 37.1 | 0.0 | - | - | - | - | - | - | |
kick100 |
the recipe as it is | - | - | - | 53.0 | Mesa ps3.282, ps3rsx 0.249 | whole run | 26.7 | 38.0 | - | - | - | 37.0 | 0.0 | - | - | - | - | - | - | |
Mesa ps3.262 runs with perf recording (audio profiling)
2026-10-17 · 2026-10-17-mesa-262-perf
Tested: Plain-named runs made while the audio profiling was going on: dsda-doom's music, OpenArena and Yamagi Quake II on Mesa ps3.262. Result: Not valid for comparison: perf was recording during these runs, which explains the slow OpenArena and Yamagi numbers. They say nothing about a change in Mesa ps3.262. What we saw
not comparable runs with perf recording (audio profiling), slower than plain runs. | |||||||||||||||||||||
basenot comparable |
the recipe as it is | - | - | - | 31.6 | Mesa ps3.262 | whole run | 25.3 | 39.4 | - | - | - | 41.5 | 0.0 | - | - | - | - | - | - | |
Mesa ps3.262 OpenAL log variants (allog; perf recording)
2026-10-17 · 2026-10-17-mesa-262-allog
Tested: How much of the CPU OpenAL's sound mixing takes in four games, profiled with perf, to see whether moving the mixer to the SPUs would pay off. Result: OpenAL itself is 3.7-4.7% of the game's CPU samples, under the 6% bar set for an SPU mixer. The frame rates are slowed by the profiler and are not for comparison. What we saw
not comparable OpenAL logging runs with perf recording, slower than plain runs. | |||||||||||||||||||||
allognot comparable |
the recipe as it is | - | - | - | 46.2 | Mesa ps3.262 | whole run | 34.9 | 36.6 | - | - | - | 38.0 | 0 | - | - | - | - | - | - | |
Mesa ps3.262 + ps3rsx 0.249
2026-10-17 · 2026-10-17-mesa-262
Tested: Mesa ps3.262 (patches 0019 to 0025: fewer words sent to the GPU per draw) across the suite, against ps3.246. Result: Big gains in several games: OpenArena +23%, Yamagi +24%, X-Moto +21%, Extreme Tux Racer and dsda-doom +15%. Armagetron fell from 60 to 51 fps, which the next batches traced. Single runs; BananaBread's drop is a memory stall, not a driver number. What we saw
| |||||||||||||||||||||
base |
the recipe as it is | - | - | - | 54.4 | Mesa ps3.262, ps3rsx 0.249 | whole run | 23.4 | 36.6 | - | - | - | 35.7 | 0 | - | - | - | - | - | - | |
Group 4 smokes (Mesa ps3.246 + ps3rsx 0.249)
2026-10-17 · 2026-10-17-group4-smokes
Tested: First runs of the heavy games with the VRAM swap on: OpenArena's OpenGL 2 renderer with two settings, SuperTuxKart, and BananaBread with GPU and with CPU skinning. Result: The heavy games are memory-bound, with no driver bug in sight: OpenArena's OpenGL 2 renderer made 10.7 to 13.6 fps with single stalls of 28.3 and 36.3 s. SuperTuxKart refused to start on a big-endian machine, and BananaBread's GPU skinning was far slower than CPU skinning. What we saw
| |||||||||||||||||||||
gl2 |
the recipe as it is | - | - | - | 10.7 | Mesa ps3.246, ps3rsx 0.249 | whole run | 13.1 | 159.7 | - | - | - | 118.3 | 0 | - | - | - | - | - | - | |
gl2min |
the recipe as it is | - | - | - | 13.6 | Mesa ps3.246, ps3rsx 0.249 | whole run | 11.8 | 97.9 | - | - | - | 80.1 | 0.0 | - | - | - | - | - | - | |
Mesa ps3.246 + ps3rsx 0.249
2026-10-17 · 2026-10-17-mesa-246-ps3rsx-249
Tested: The first full suite round after the reboot into ps3rsx 0.249, one run per game, as a baseline. Result: Every game ran with the right picture. The sound was right except in dsda-doom (MIDI music), BananaBread and OpenTTD. Single runs, so differences of a few fps are noise. What we saw
| |||||||||||||||||||||
base |
the recipe as it is | - | - | - | 44.2 | Mesa ps3.246, ps3rsx 0.249 | whole run | 37.3 | 39.4 | - | - | - | 38.5 | 0 | - | - | - | - | - | - | |
Mesa ps3.223 + ps3rsx 0.219
2026-10-16 · 2026-10-16-mesa-223
Tested: Where the CPU time goes in five games on Mesa ps3.223, each profiled for 15 s. Result: The driver stack, not the games, takes most of the CPU: Mesa 28 to 56%, ps3rsx 6 to 16%. That started the per-draw work in Mesa ps3.246 and ps3.262 and ps3rsx 0.249. The profiler slowed the runs, so the fps are not for comparison. What we saw
not comparable every game was profiled with perf during the run, which slows it. | |||||||||||||||||||||
tc1not comparable |
the recipe as it is | - | - | - | 37.2 | Mesa ps3.223, ps3rsx 0.219 | whole run | 19.0 | 39.4 | - | - | - | 43.5 | - | - | - | - | - | - | - | |
Stage 0 validation (Mesa ps3.186 + ps3rsx 0.219; picture on screen)
2026-10-16 · 2026-10-16-stage0-validation
Tested: The first runs with the picture really on screen, checked on the webcam, after both ps3rsx display fixes and Openbox in the harness. Result: Valid: the display fixes work, and these are the first real game numbers (OpenArena 42.2 fps, ClassiCube 50.5). Showing the frames costs: the same OpenArena runs without a picture gave 45 to 54 fps. What we saw
| |||||||||||||||||||||
tc1 |
the recipe as it is | - | - | - | 42.2 | Mesa ps3.186, ps3rsx 0.219 | whole run | 46.5 | 36.6 | - | - | - | 42.4 | - | - | - | - | - | - | - | |
Stage 0 after ps3rsx 8baa747 (second X still black)
2026-10-16 · 2026-10-16-stage0-8baa747
Tested: OpenArena and ClassiCube after the first ps3rsx black-screen fix, with the harness now starting a window manager (Openbox). Result: Presumably invalid: the remaining bug (a new X session after the last one quit started muted) was fixed only after these runs, so the screen was probably still black. The validated numbers are in the next batch. What we saw
invalid the second X was still black, so the frame rates are not of a shown picture. | |||||||||||||||||||||
tc1invalid |
the recipe as it is | - | - | - | 45.0 | - | whole run | 35.0 | 36.6 | - | - | - | 39.2 | - | - | - | - | - | - | - | |
tc1nowminvalid |
the recipe as it is | - | - | - | 44.6 | - | whole run | 38.0 | 38.0 | - | - | - | 39.9 | - | - | - | - | - | - | - | |
Stage 0 first games/bench runs (ps3rsx before a1f1b91; black screen)
2026-10-16 · 2026-10-16-stage0-first
Tested: The first OpenArena runs through the new benchmark harness, mixed with runs of the old one, plus glxgears on two virtual terminals. Result: Invalid: the screen stayed black, so the frame rates (51.1 and 50.3 fps) don't count, and the load times may be misparsed. The black screen was hunted down in the next batches. What we saw
invalid a black screen (ps3rsx before a1f1b91), so the frame rates are not of a shown picture. | |||||||||||||||||||||
tc1invalid |
the recipe as it is | - | - | - | 51.1 | - | whole run | 38.7 | 39.4 | - | - | - | 40.5 | - | - | - | - | - | - | - | |
tc1nowminvalid |
the recipe as it is | - | - | - | 50.3 | - | whole run | 37.4 | 38.0 | - | - | - | 38.4 | - | - | - | - | - | - | - | |
libspeq SPU DXT1 encoder 0.210 (Mesa ps3.186; nothing on screen)
2026-10-16 · 2026-10-16-speq-spu-dxt1
Tested: libspeq 0.210's DXT1 encoder on the SPEs: whether it matches the reference output, how fast it is, and whether it removes the load cost of compressed textures in OpenArena. Result: Yes on all three: byte-for-byte correct, 1173 Mpixel/s against 6.7 on the PPE, and compressed textures now load as fast as plain ones (13.63 s against 13.84 s). The load, VRAM and SPU results stand; the fps are invalid because nothing was on screen. What we saw
invalid nothing reached the screen, so the frame rates are not of a shown picture. | |||||||||||||||||||||
tc0invalid |
the recipe as it is | - | - | - | 49.1 | Mesa ps3.186 | whole run | 27.3 | - | - | - | - | 35.5 | - | - | - | - | - | - | - | |
tc1invalid |
the recipe as it is | - | - | - | 52.7 | Mesa ps3.186 | whole run | 28.6 | - | - | - | - | 35.3 | - | - | - | - | - | - | - | |
tc1debuginvalid |
the recipe as it is | - | - | - | 54.4 | Mesa ps3.186 | whole run | 28.7 | - | - | - | - | 35.3 | - | - | - | - | - | - | - | |
libspeq PPE DXT1 encoder in Mesa ps3.186 (kernel .178; nothing on screen)
2026-10-16 · 2026-10-16-speq-ppe-dxt1
Tested: Whether libspeq's faster DXT1 encoder, called from Mesa ps3.186 on the main CPU, removes the load-time cost of compressed textures in OpenArena. Result: Mostly: compression now costs 0.5 s of load instead of 1.5 s, without hitches, and the game's VRAM falls from 51.6 to 37.5 MB. This was the basis for shipping compressed textures in OpenArena. The frame rates are invalid (nothing on screen). What we saw
invalid nothing reached the screen, so the frame rates are not of a shown picture (load times and VRAM are valid). | |||||||||||||||||||||
tc0invalid |
the recipe as it is | - | - | - | 49.9 | Kernel ps3.178, Mesa ps3.186 | whole run | 26.9 | - | - | - | - | 35.3 | - | - | - | - | - | - | - | |
tc1invalid |
the recipe as it is | - | - | - | 53.0 | Kernel ps3.178, Mesa ps3.186 | whole run | 28.4 | - | - | - | - | 35.8 | - | - | - | - | - | - | - | |
Step 0: OpenArena perf profiles A/B/C (nothing on screen)
2026-10-16 · 2026-10-16-step0-perf
Tested: CPU profiles of OpenArena with sound variants A, B and C, to see how much of the sound's cost is OpenAL's mixer. Result: Inconclusive: the profiles could not identify OpenAL's mixer thread, and the profiler slowed the runs, so their numbers are not for comparison. A re-profile with matching debug symbols followed on 2026-10-17. What we saw
invalid nothing reached the screen, and the runs recorded perf profiles. | |||||||||||||||||||||
profAinvalid |
the recipe as it is | - | - | - | 57 | - | whole run | 39.6 | - | - | - | - | 51.7 | - | - | - | - | - | - | - | |
profBinvalid |
the recipe as it is | - | - | - | 57 | - | whole run | 45.0 | - | - | - | - | 53.1 | - | - | - | - | - | - | - | |
profCinvalid |
the recipe as it is | - | - | - | 57 | - | whole run | 38.0 | - | - | - | - | 52.6 | - | - | - | - | - | - | - | |
Step 0: OpenArena sound variants A/B/B22/C/Z (nothing on screen)
2026-10-16 · 2026-10-16-step0-sound
Tested: How much OpenArena's sound costs: stock OpenAL, two tuned OpenAL settings, the game's own mixer, and sound off. Result: Sound off was about 10% faster (55.3 against 49.7 to 50.0 fps) and no OpenAL setting helped. The result is weak: nothing was on screen, the tuned settings later turned out to change more than intended, and the gap was not repeated with a picture in these runs. What we saw
invalid nothing reached the screen, so the frame rates are not of a shown picture. | |||||||||||||||||||||
sndAinvalid |
the recipe as it is | - | - | - | 49.7 | - | whole run | 28.6 | - | - | - | - | 35.2 | - | - | - | - | - | - | - | |
sndBinvalid |
the recipe as it is | - | - | - | 49.8 | - | whole run | 29.6 | - | - | - | - | 37.3 | - | - | - | - | - | - | - | |
sndB22invalid |
the recipe as it is | - | - | - | 50.0 | - | whole run | 28.2 | - | - | - | - | 37.3 | - | - | - | - | - | - | - | |
sndCinvalid |
the recipe as it is | - | - | - | 50.0 | - | whole run | 28.4 | - | - | - | - | 33.3 | - | - | - | - | - | - | - | |
sndZinvalid |
the recipe as it is | - | - | - | 55.3 | - | whole run | 35.7 | - | - | - | - | 26.2 | - | - | - | - | - | - | - | |
Step 0: OpenArena tc0/tc1 on Mesa ps3.152 (VRAM swap on; nothing on screen)
2026-10-16 · 2026-10-16-step0-vswap-on
Tested: The same OpenArena comparison of plain and compressed textures on Mesa ps3.152, now with the VRAM swap on. Result: Not valid as frame rates (nothing on screen). The load times show Mesa's encoder costing 1.1 s of load and causing hitches in play, so compressed textures were not shipped with that encoder. What we saw
invalid nothing reached the screen, so the frame rates are not of a shown picture. | |||||||||||||||||||||
tc0invalid |
the recipe as it is | - | - | - | 48.8 | Mesa ps3.152 | whole run | 31.4 | - | - | - | - | 35.6 | - | - | - | - | - | - | - | |
tc1invalid |
the recipe as it is | - | - | - | 52.4 | Mesa ps3.152 | whole run | 25.3 | - | - | - | - | 36.6 | - | - | - | - | - | - | - | |
Step 0: OpenArena tc0/tc1 on Mesa ps3.152 (VRAM swap off; nothing on screen)
2026-10-16 · 2026-10-16-step0-vswap-off
Tested: The first OpenArena timedemo runs on the PS3, comparing plain textures with compressed (DXT1) textures made by Mesa's own encoder, VRAM swap off. The first compressed texture ever drawn on the RSX was sampled too. Result: Not valid as frame rates: nothing reached the screen. The load times and VRAM still count: Mesa's encoder added about 1.5 s to the level load, and compressed textures cut the game's VRAM from 51.7 to 40.3 MB. What we saw
invalid nothing reached the screen (no window manager, and ps3rsx left the video muted), so the frame rates are not of a shown picture. | |||||||||||||||||||||
tc0invalid |
the recipe as it is | - | - | - | 49.8 | Mesa ps3.152 | whole run | 26.4 | - | - | - | - | 35.5 | - | - | - | - | - | - | - | |
tc1invalid |
the recipe as it is | - | - | - | 51.6 | Mesa ps3.152 | whole run | 27.8 | - | - | - | - | 36.8 | - | - | - | - | - | - | - | |